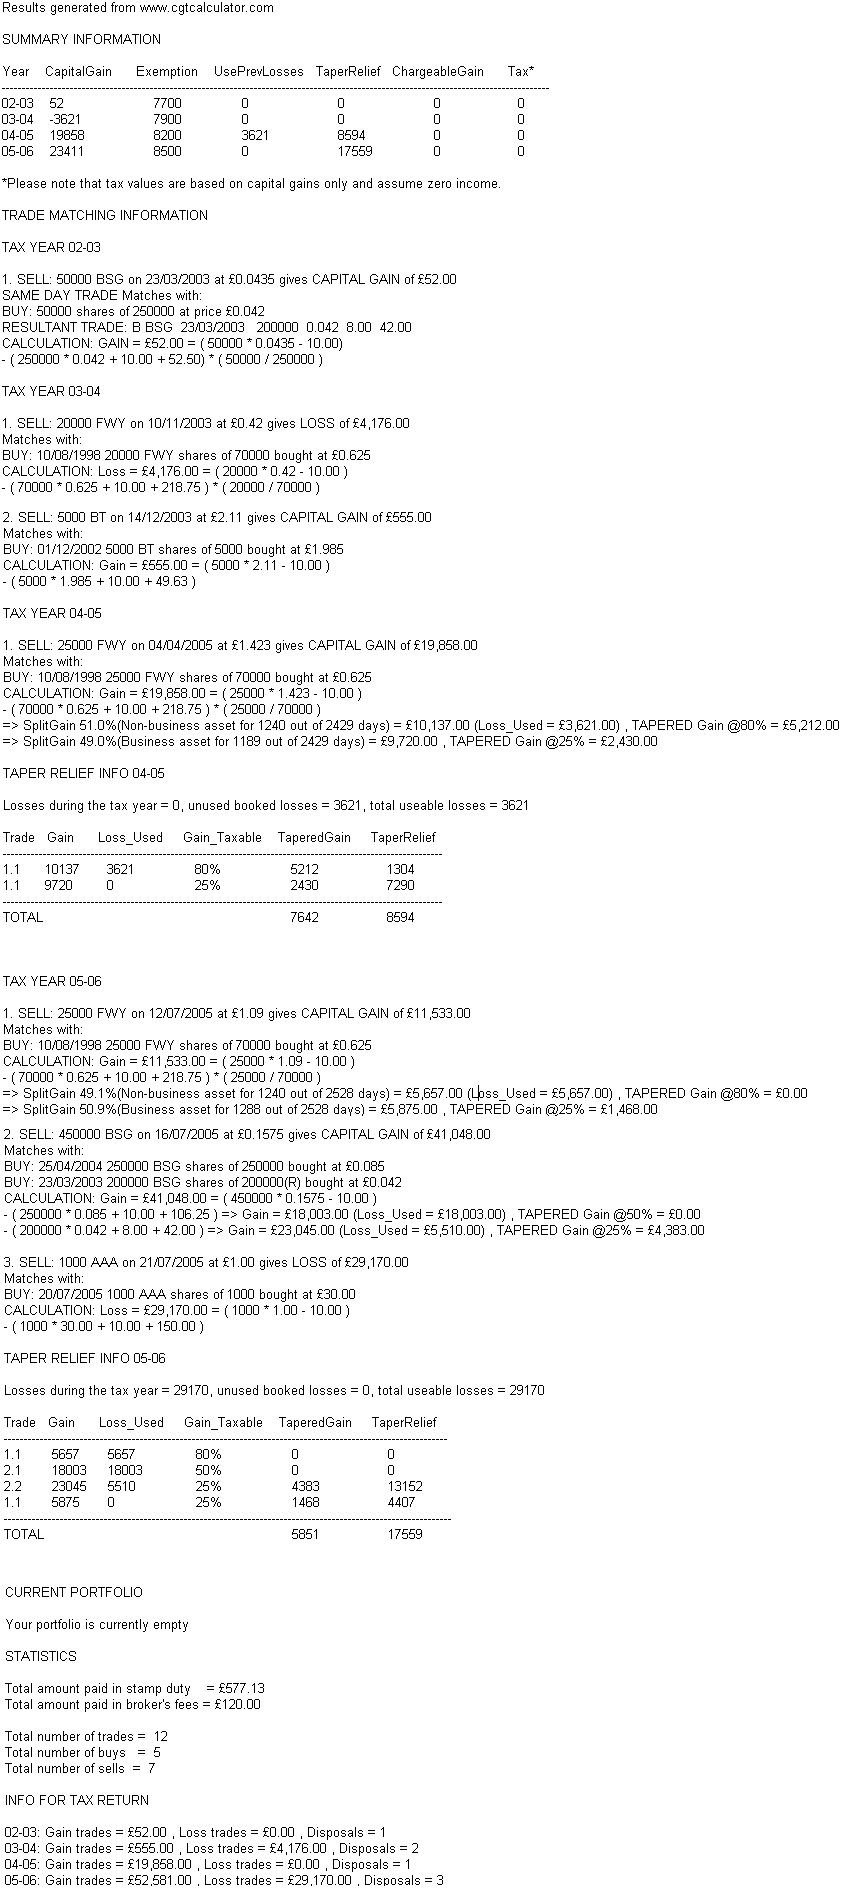
Example 4 - Taper Relief and Change of Status
Note for sales after 4th April 2008 taper relief is no longer available.
You can test out the following example by copying and pasting the trades into the
calculator . The trade format and instructions
can be viewed here. Note
that "U" appended to the end of the trade means the stock is treated as a business
asset (AIM, OFEX or unlisted stock).
The first line indicates that FWY changed to a business asset on 1st January 2002
and therefore became eligible for a more favourable rate of taper relief.
|
C |
01/01/2002 |
FWY |
U |
|
|
|
|
|
B |
10/08/1998 |
FWY |
70000 |
0.625 |
10.00 |
218.75 |
|
|
B |
01/12/2002 |
BT |
5000 |
1.985 |
10.00 |
49.63 |
|
|
S |
23/03/2003 |
BSG |
50000 |
0.0435 |
10.00 |
0.00 |
U |
|
B |
23/03/2003 |
BSG |
250000 |
0.042 |
10.00 |
52.50 |
U |
|
S |
10/11/2003 |
FWY |
20000 |
0.42 |
10.00 |
0.00 |
|
|
S |
14/12/2003 |
BT |
5000 |
2.11 |
10.00 |
0.00 |
|
|
B |
25/04/2004 |
BSG |
250000 |
0.085 |
10.00 |
106.25 |
U |
|
S |
04/04/2005 |
FWY |
25000 |
1.423 |
10.00 |
0.00 |
U |
|
S |
12/07/2005 |
FWY |
25000 |
1.09 |
10.00 |
0.00 |
U |
|
S |
16/07/2005 |
BSG |
450000 |
0.1575 |
10.00 |
0.00 |
U |
|
B |
20/07/2005 |
AAA |
1000 |
30.00 |
10.00 |
150.00 |
|
|
S |
21/07/2005 |
AAA |
1000 |
1.00 |
10.00 |
0.00 |
|
Results
There is a taper relief table for each tax year where taper relief is calculated.
This is to make it easier to see where same year losses have been assigned. Remember
that losses are assigned first to gains with the lowest taper relief. Note also
the syntax within the taper relief tables that is used to define trade numbers;
eg."trade 2.3" refers to the 3rd buy trade that partially matches with the 2nd sell
in that tax year. Where there is a 'splitgain' due to a company changing to/from
a business asset then there will be 2 trades with the same trade number.
