
|
|
|
|
|
|
|
Its important you understand how to copy & paste information across Windows applications. Its really very simple. You can select the entire contents of a text box by placing the cursor in the box and then selecting Edit->Select_All from the Internet Explorer menu bar. Then Edit->Copy (or CTRL+C) copies the data to the clipboard. Edit-Paste (or CTRL+V) pastes the contents of the clipboard to a new application.
OK heres some general info.
Each trade entry must contain at least 6 items of data in a line. These are B(uy) or S(ell), Date, Company, Shares, Price and Charges. See below.
Each item is separated by white space, either tab(s) or spaces(s). All text is case insensitive.
The calculator sorts all trades into date order. The calculation should be faster however if your trades are already in date order.
All currency values are represented in UK pounds.
For trades before 6 April 1998 the Inland Revenue requires that these are 'pooled'. For this calculator to work properly the user should reduce all trades for a specific share before this date into a single entry.
Select the show calcs check-box if you want to see the arithmetic calculation for each gain/loss.
Select the show stats check-box to display:
1) your current portfolio, based on your share trades.
2) your tax information for each tax year.
3) the totals you have paid in stamp-duty and brokers' fees.
Note: Since the show stats option requires the trades to be re-sorted into name order there may be a noticeable delay if you have a large number of trades. Also this option requires both Tax Year and Company to be set to "ALL".
You can reduce the amount of output information by selecting a specific tax year and/or a specific share in the text boxes provided. Note that if these boxes are left blank, or contain duff data, then they reset to ALL which displays results for all shares for all tax years. When setting the tax year type in the year the tax year begins eg. For tax year 02-03 type 2002.
The Format/Sort button will tabulate each item in each trade and calculate stamp-duty (if this field is missing). The trades are then sorted into date order. This function is optional and is just a tool to allow you to save an ordered and formatted list of your trades.
To print the calculations or trades, copy and paste the data from the relevant text box into Windows WordPad or NotePad and print from there.
| B/S | Date | Company | Shares | Price | Charges | Tax |
| B | 12/01/2004 | AVG | 10000 | 0.525 | 10.0 | 26.25 |
| S | 23/02/2004 | NCH | 5000 | 1.75 | 12.50 | 0.0 |
The fields are:
1. The 1st field indicates whether the trade is a buy or a sell. Valid values are B, S, BUY, SELL.
2. The 2nd field is the date. Valid date formats are dd/mm/yy or dd/mm/yyyy
3. The 3rd field identifies the company. I recommend using the company's epic since this is unique for each company in the London Stock Exchange. This should also ensure the live portfolio function will work ok. This field is case insensitive and must consist of 1 word only. If you use the company name then join separate words with an underscore or dash.
4. The 4th field is the number of shares traded.
5. The 5th field is the share price
6. The 6th field represents the costs associated with the trade. This really means broker's fees but its also valid to include telephone charges.
7. The 7th field is optional. It represents stamp duty when shares are purchased. If missing, stamp duty is set at 0.5% of the trade cost for buys. It is set to zero for a sell. The reason this field is included is because some shares are exempt from stamp duty. Those traded using SETS for example.
8. The 8th field is also optional. This should be set to "U" if the stock is unquoted or an AIM or OFEX stock. Otherwise it should be left blank. Its purpose to identify those stocks that may be subject to more favourable rates of taper relief. Note for sales after 4th April 2008 taper relief is no longer available and this field will be ignored.
Historically this calculator has calculated a gain/loss for each trade and then rounded the result down to the nearest pound in a similar manner to several previous capital gains examples published by HMRC. However since there are conflicting responses from HMRC when this question is posed, from the 2011 tax year onwards the calculator has an option to NOT round capital gains/losses for each trade. Instead the result is calculated to 2 decimal places. In this case only the capital/gain loss for the entire tax year is rounded. This option is applied when the Rounding checkbox is deselected. Since the HMRC refuses to clarify this issue it is up to each individual which option to use. Note however that whichever option is used there is only likely to be a material difference in the calculated capital/gain loss if a very large number of trades was undertaken during the tax year.
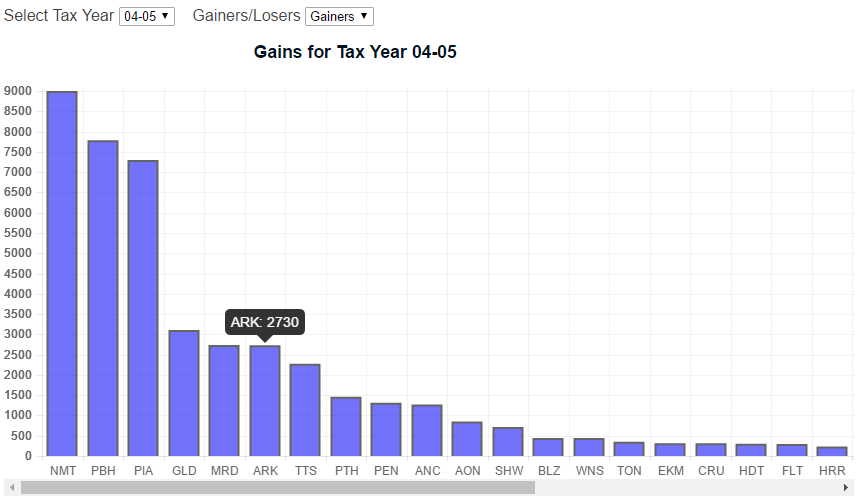
Clicking the View Chart button will produce a chart showing how each stock contributed to the gain or loss for the tax year. Select the specific tax year you are interested in and whether to display stocks that were overall gainers or losers. An example chart is shown below.
| Date | Company | Restructuring Factor | |
| R | 12/01/2004 | AAA | 10 |
| R | 23/02/2004 | BBB | 0.1 |
Each line contains 4 fields, starting with "R". The next field is the date of the restructuring. Next is the company identifier. Finally the last field is the restructuring factor. The first example shows a 10 for 1 restructuring. The 2nd example shows a 1 for 10 restructuring. Only use this function once for each stock. You can place the restructuing instruction anywhere within your trades file.
Also note that if the restructuring factor is, for example, 1 for 7 (0.14285) its possible rounding effects will result in you having one more(or less) share than you expected. This can result in matching errors. If this occurs you may have to tweak the restructuring factor. ie. try 0.143 or 0.142 until the result is OK.
The capital gain or loss for each year is calculated and displayed. Capital gains TAX (CGT) is also shown if the tax year is after 2000. Note the CGT is based solely on capital gains on share trades.
Scroll down to the bottom of the results to see Disposal Proceeds, Allowable Costs, Number of Disposals, Year Gains and Year Losses. These values are required for completing the capital gains tax return.
The matching information, and resulting gain or loss, for each SELL is displayed. This shows which BUYS, or the proportion of a BUY, matches with each SELL.
For same day trades an integer in brackets indicates how many individual trades have been added together to create the composited same day trade. The brokers charges and stamp-duty charges are also added together. See here for more info.
If a trade is shown with an 'R' in brackets then it is the net result of a same day trade match. This occurs when the number of shares bought and sold for a specific stock in the same day are different creating a residual trade. The brokers charges, and stamp-duty charges if applicable, for residual trades are calculated as a simple percentage of the matching buy or sell trade.
Taper relief is only calculated for sales before 5th April 2008 and if the chargeable gain for the year is greater than the capital gains exemption AFTER previous year losses are used up. For more on taper relief output information see example2 and example3
| Date | Company | Status | |
| C | 12/01/2004 | BNG | U |
| C | 23/02/2004 | MKI | L |
Each line contains 4 fields, starting with "C". The next field is the date of the change of status. Next is the company identifier. Finally the last field can be either "U", which represents a change from a non-business asset to a business asset, or "L" which represents a change from a business asset to a non-business asset. Most AIM and OFEX stocks are considered to be business assets and have more favourable rates of taper relief. Dont change the status of a stock more than once. The program cant handle it! You can place the change of status lines anywhere within your trades file. Note for sales after 4th April 2008 taper relief is no longer available so this function is not relevant.
You can apply the same to the Trades text-box